Understanding Options Buying & Selling
Options buying and selling are key strategies used in financial markets to capitalize on price movements in underlying assets. Options provide traders with the right, but not the obligation, to buy (call options) or sell (put options) the underlying asset at a predetermined price within a specified time period. Options buying involves purchasing call or put options with the expectation that the price of the underlying asset will move in a favorable direction. This strategy allows traders to potentially profit from both upward and downward price movements, depending on the type of options purchased. On the other hand, options selling involves writing or selling call or put options with the aim of generating income through the premium received. This strategy is suitable for traders who anticipate limited price movements or expect the market to remain range-bound. Understanding the dynamics of options buying and selling, including factors such as implied volatility, strike prices, expiration dates, and risk management, is essential for traders to effectively navigate the options market and make informed trading decisions.
Nifty and Bank Nifty options are widely traded instruments in the Indian financial markets. Nifty options are based on the Nifty 50 index, which represents the performance of the 50 largest and most actively traded stocks on the National Stock Exchange (NSE) of India. Bank Nifty options, on the other hand, are based on the Bank Nifty index, comprising the most liquid and influential banking stocks in the Indian market. Understanding options buying and selling in the context of Nifty and Bank Nifty involves analyzing the price movements and volatility of these indices and their underlying components. Traders engage in options buying by purchasing call or put options on Nifty or Bank Nifty, depending on their market outlook and expectations of price movements.
This strategy allows them to potentially profit from the overall market trends or specific sectoral movements. Conversely, options selling in Nifty and Bank Nifty involves writing or selling call or put options to generate income through the premium received. Traders who employ this strategy anticipate limited price movements or expect the indices to remain range-bound within a specific time frame. It is essential for traders to closely monitor market trends, technical indicators, and news events that can impact Nifty and Bank Nifty options prices to make informed decisions while buying or selling these options.
Implied Volatility Gauging Market Expectations
Implied Volatility (IV) plays a crucial role in options pricing. It represents the market’s expectations of future price fluctuations in the underlying asset. High IV suggests that the market anticipates significant price movements, resulting in more expensive options. Traders, seeking potential buying opportunities, may look for options with relatively low IV. By doing so, they aim to capitalize on undervalued options that have the potential for significant price swings.
Technical Analysis Indicators – Analyzing Price Patterns and Momentum
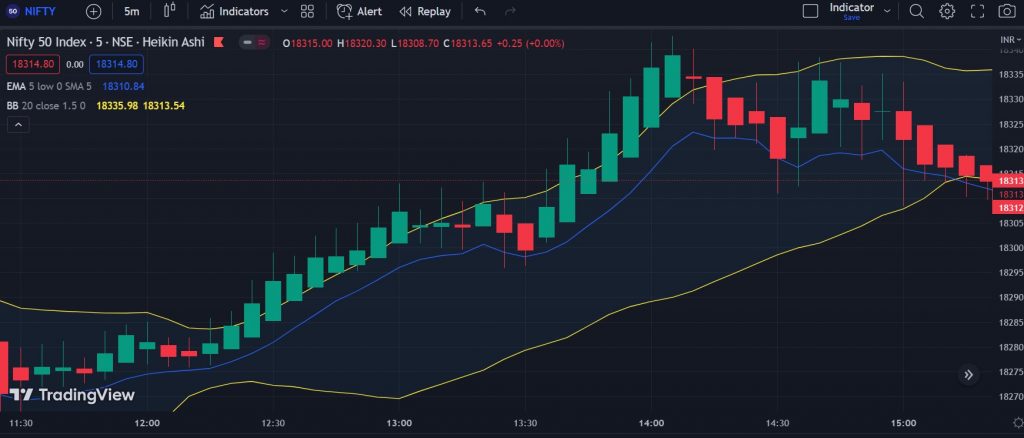
Technical analysis indicators provide valuable insights into price patterns, trends, and momentum. Options traders often utilize moving averages, Bollinger Bands, RSI (Relative Strength Index), and MACD (Moving Average Convergence Divergence) to identify optimal entry and exit points for their trades. These indicators assist traders in understanding the underlying asset’s price behavior and making informed decisions regarding options buying.
| Indicator Name | Description | Accuracy |
| Moving Average (MA) | Average price over a specific period, helps identify trends | High |
| Relative Strength Index (RSI) | Indicates overbought or oversold conditions | High |
| MACD (Moving Average Convergence Divergence) | Shows trend reversals and bullish or bearish signals | High |
| Bollinger Bands | Volatility indicator showing price levels relative to moving average | High |
| Stochastic Oscillator | Identifies overbought or oversold conditions | Medium |
| ADX (Average Directional Index) | Measures trend strength and potential for trend reversal | Medium |
| Ichimoku Cloud | Provides support and resistance levels, trend identification | Medium |
| Fibonacci Retracement | Highlights potential support and resistance levels | Medium |
| Volume Profile | Displays trading volume at different price levels | Low |
| On-Balance Volume (OBV) | Indicates buying or selling pressure based on volume | Low |
Volume and Open Interest Assessing Market Liquidity
Volume and open interest are vital indicators of market liquidity and participation. Higher volume and open interest in a particular option contract imply increased liquidity, making it easier for traders to enter and exit trades at desired prices. Therefore, options traders often prefer contracts with substantial volume and open interest as they provide a more favorable trading environment.
Identifying Key Price Levels – Support and Resistance Levels
Support and resistance levels are critical technical analysis concepts used by options traders. Support levels represent areas where historical buying interest has emerged, while resistance levels indicate zones where significant selling pressure has been observed. Traders often consider options strategies when the underlying asset’s price approaches these key levels. By doing so, they aim to benefit from potential price reversals or breakouts, providing profitable options buying opportunities.
News and Fundamental Analysis
News events, earnings announcements, economic data releases, and other fundamental factors can significantly impact options prices. Traders who engage in options buying often incorporate fundamental analysis to assess the potential impact of these factors on options contracts. By staying informed about relevant news and understanding the underlying asset’s fundamentals, traders can identify potential opportunities for profitable options buying.
In conclusion, while no single indicator guarantees accurate predictions in options buying, traders often rely on a combination of indicators to make well-informed decisions. Implied volatility, technical analysis indicators, volume and open interest, support and resistance levels, and fundamental analysis all play a role in identifying potential options buying opportunities. However, it is crucial for traders to understand the risks associated with options trading and conduct thorough research or seek advice from financial professionals before engaging in such activities.
Leave a Reply